Best Time to Visit Horseshoe Bend
Month-by-month weather, storm seasons and trail conditions around Page
The climate record kept for Page, the nearest town to Horseshoe Bend, falls under the Köppen class BWk: arid, with summers that are hot and very dry and winters that are chilly with very little snow. The sections below set out month-by-month averages, the timing of storms and flood risk, and the conditions that apply to individual activities.
Check dates and prices
Climate at a glance
Page receives about 6.46 inches of rain per year, a total below that of Phoenix in the Sonoran Desert. Page is very dry; it lies in the rainshadow of the California mountains and is too far north for consistent monsoons.
Most of it falls as rain, although winter storms occasionally bring snow, especially at higher elevations in the area. The record high temperature for Page is 111 °F, recorded on July 9 and 10, 2021.
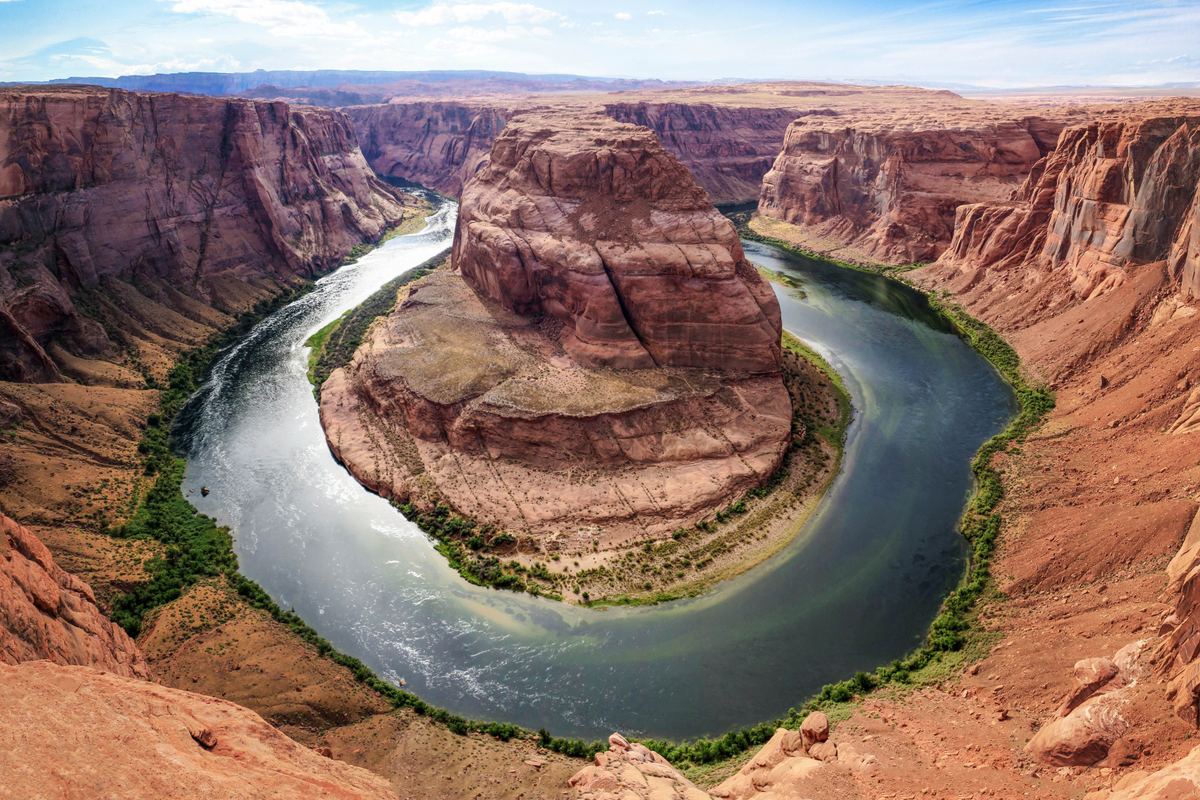
Month by month temperatures
Page, Arizona has a mean daily maximum temperature of 44.6 °F (7.0 °C) in January and 51.3 °F (10.7 °C) in February, based on 1991–2020 averages.
| Month | Mean daily maximum | Daily mean | Mean daily minimum |
|---|---|---|---|
| January | 44.6 °F (7.0 °C) | 35.5 °F (1.9 °C) | 26.4 °F (−3.1 °C) |
| February | 51.3 °F (10.7 °C) | 40.8 °F (4.9 °C) | 30.4 °F (−0.9 °C) |
| March | 61.8 °F (16.6 °C) | 49.7 °F (9.8 °C) | 37.6 °F (3.1 °C) |
| April | 70.5 °F (21.4 °C) | 57.4 °F (14.1 °C) | 44.4 °F (6.9 °C) |
| May | 80.7 °F (27.1 °C) | 67.1 °F (19.5 °C) | 53.6 °F (12.0 °C) |
| June | 92.2 °F (33.4 °C) | 77.8 °F (25.4 °C) | 63.4 °F (17.4 °C) |
| July | 96.5 °F (35.8 °C) | 83.1 °F (28.4 °C) | 69.7 °F (20.9 °C) |
| August | 93.5 °F (34.2 °C) | 80.5 °F (26.9 °C) | 67.6 °F (19.8 °C) |
| September | 84.9 °F (29.4 °C) | 72.1 °F (22.3 °C) | 59.4 °F (15.2 °C) |
| October | 70.9 °F (21.6 °C) | 58.8 °F (14.9 °C) | 46.8 °F (8.2 °C) |
| November | 55.2 °F (12.9 °C) | 44.9 °F (7.2 °C) | 34.5 °F (1.4 °C) |
| December | 43.8 °F (6.6 °C) | 35.4 °F (1.9 °C) | 26.9 °F (−2.8 °C) |
Long-term monthly averages for Page, Arizona.
| Item | Value (°F) |
|---|---|
| Jan | 44.6 |
| Feb | 51.3 |
| Mar | 61.8 |
| Apr | 70.5 |
| May | 80.7 |
| Jun | 92.2 |
| Jul | 96.5 |
| Aug | 93.5 |
| Sep | 84.9 |
| Oct | 70.9 |
| Nov | 55.2 |
| Dec | 43.8 |
Month by month rainfall
The table gives average precipitation and the average number of days with at least 0.01 in of precipitation, again for 1991–2020.
| Month | Average precipitation | Days with at least 0.01 in |
|---|---|---|
| January | 0.65 in (17 mm) | 4.1 |
| February | 0.51 in (13 mm) | 5.3 |
| March | 0.54 in (14 mm) | 4.5 |
| April | 0.38 in (9.7 mm) | 3.6 |
| May | 0.44 in (11 mm) | 2.7 |
| June | 0.13 in (3.3 mm) | 1.4 |
| July | 0.58 in (15 mm) | 3.5 |
| August | 0.93 in (24 mm) | 6.5 |
| September | 0.93 in (24 mm) | 4.6 |
| October | 0.92 in (23 mm) | 4.1 |
| November | 0.45 in (11 mm) | 2.9 |
| December | 0.42 in (11 mm) | 4.2 |
December to February
Average highs in Page stand at 43.8 °F (6.6 °C) in December, 44.6 °F (7.0 °C) in January and 51.3 °F (10.7 °C) in February. Nights reach 26.9 °F (−2.8 °C) in December and 26.4 °F (−3.1 °C) in January as mean daily minimums, while February's mean daily minimum is 30.4 °F (−0.9 °C).
Daily means are 35.4 °F (1.9 °C) in December, 35.5 °F (1.9 °C) in January and 40.8 °F (4.9 °C) in February. Precipitation totals 0.42 in (11 mm) in December over 4.2 days, 0.65 in (17 mm) in January over 4.1 days and 0.51 in (13 mm) in February over 5.3 days. Winter storms occasionally bring snow, especially at higher elevations in the area.
March to May
Mean daily maximums climb from 61.8 °F (16.6 °C) in March to 70.5 °F (21.4 °C) in April and 80.7 °F (27.1 °C) in May. The daily mean rises from 49.7 °F (9.8 °C) to 57.4 °F (14.1 °C) and then 67.1 °F (19.5 °C), and the mean daily minimum goes from 37.6 °F (3.1 °C) through 44.4 °F (6.9 °C) to 53.6 °F (12.0 °C).
March brings 0.54 in (14 mm) of precipitation over 4.5 days, April 0.38 in (9.7 mm) over 3.6 days and May 0.44 in (11 mm) over 2.7 days.
June to August
June's average high reaches 92.2 °F (33.4 °C), July's reaches 96.5 °F (35.8 °C) and August's reaches 93.5 °F (34.2 °C). Daily means run 77.8 °F (25.4 °C) in June, 83.1 °F (28.4 °C) in July and 80.5 °F (26.9 °C) in August, with mean daily minimums of 63.4 °F (17.4 °C), 69.7 °F (20.9 °C) and 67.6 °F (19.8 °C). The record high of 111 °F fell on July 9 and 10, 2021.
Rainfall is 0.13 in (3.3 mm) over 1.4 days in June, 0.58 in (15 mm) over 3.5 days in July and 0.93 in (24 mm) over 6.5 days in August.
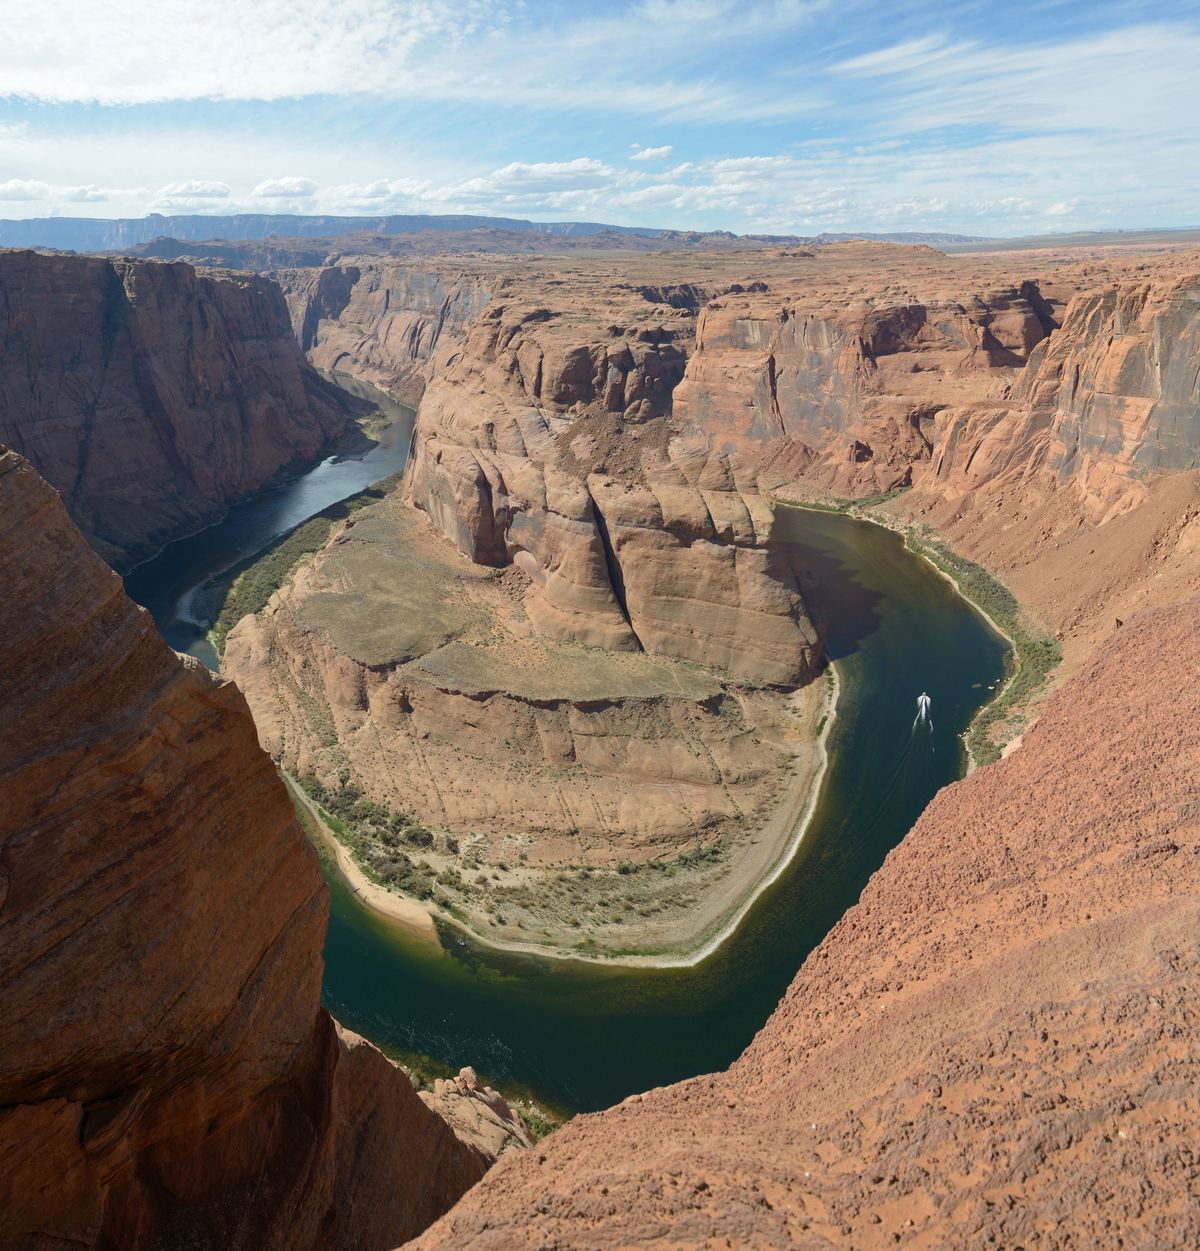
September to November
The mean daily maximum falls from 84.9 °F (29.4 °C) in September to 70.9 °F (21.6 °C) in October and 55.2 °F (12.9 °C) in November. Daily means over the same months are 72.1 °F (22.3 °C), 58.8 °F (14.9 °C) and 44.9 °F (7.2 °C), and mean daily minimums are 59.4 °F (15.2 °C), 46.8 °F (8.2 °C) and 34.5 °F (1.4 °C).
September records 0.93 in (24 mm) of precipitation over 4.6 days, October 0.92 in (23 mm) over 4.1 days and November 0.45 in (11 mm) over 2.9 days.
Storm seasons and flash flood risk
| Activity | Jan | Feb | Mar | Apr | May | Jun | Jul | Aug | Sep | Oct | Nov | Dec |
|---|---|---|---|---|---|---|---|---|---|---|---|---|
| Pacific storms reaching the Glen Canyon area | JanRuns | FebRuns | MarRuns | AprRuns | MayRuns | Not listed | Not listed | Not listed | Not listed | Not listed | NovRuns | DecRuns |
| Frequent Grand Canyon summer thunderstorms | Not listed | Not listed | Not listed | Not listed | Not listed | Not listed | JulRuns | AugRuns | SepRuns | Not listed | Not listed | Not listed |
- Runs
Only periods named in the cited facts are shown.
Grand Canyon summer thunderstorms occur mainly between 11 a.m. and 6 p.m. and are frequent in July, August and early September. Water in canyons can rise quickly downstream from heavy rain even when the parent thunderstorm is miles away, and hikers in slot canyons of the Glen Canyon region have been killed by flash floods generated by thunderstorms as far as 25 miles away.
Flash flooding can also occur at any low water crossing or dip, including on roads, and drivers should not enter flooded roadways.
Conditions by activity
Flash flooding can close Antelope Canyon for up to several months.
| Activity | Detail |
|---|---|
| Antelope Canyon | Flash flooding can close it for up to several months. |
| Slot canyons in the Glen Canyon region | Hikers have been killed by flash floods generated by thunderstorms as far as 25 miles away. |
| Colorado River raft float | The float from Glen Canyon Dam to Lees Ferry takes about 3 hours. |
| Colorado River raft operator | It also provides backhaul service for private paddlecraft. |
| Lake Powell boat tours | Multiple tours depart from Wahweap Marina, and charter tours operate from Halls Crossing. |
| Guided services in Glen Canyon | The National Park Service requires specific authorizations for commercial businesses. |
| Grand Canyon North Rim day trip from Page | Cooler temperatures and fewer people than the South Rim. |
Horseshoe Bend trail conditions
The Horseshoe Bend trail carries two shade structures along its length, and the overlook has none. No drinking water is supplied along the route, so visitors must bring their own. There are no toilets along the trail either; the toilets are in the parking lot, where visitors should stop before hiking.
Pets on a leash are permitted on the trail, and pets must never be left alone in a vehicle.
As of 2025 the City of Page charges $10 per passenger car to park at the trailhead. The lot is on city land, so America the Beautiful and National Park Service passes do not apply to it.
Tours and activities
Tours around Page
Questions about timing and weather
How much rain does Page get in a year?
Page receives about 6.46 inches of rain per year. Precipitation is bimodal, with a late summer to early fall peak and a late winter peak.
Which month has the hottest average daily maximum?
July, with a mean daily maximum of 96.5 °F (35.8 °C) over 1991–2020. The record high for Page is 111 °F, recorded on July 9 and 10, 2021.
How cold do winter nights get in Page?
The mean daily minimum is 26.9 °F (−2.8 °C) in December and 26.4 °F (−3.1 °C) in January.
When do thunderstorms occur?
Grand Canyon summer thunderstorms occur mainly between 11 a.m. and 6 p.m. and are frequent in July, August and early September.
Can flooding shut Antelope Canyon?
Yes. Flash flooding can close Antelope Canyon for up to several months.
How far away can a storm be and still cause a flash flood?
Hikers in Glen Canyon region slot canyons have been killed by flash floods from thunderstorms as far as 25 miles away. Water in canyons can rise quickly even when the parent thunderstorm is miles away.
Is there drinking water on the Horseshoe Bend trail?
No drinking water is provided along the trail, and visitors must bring their own.
What does trailhead parking cost?
As of 2025 the City of Page charges $10 per passenger car, and America the Beautiful and National Park Service passes do not apply.
Sources
- Page, Arizona
- Climate Change - Glen Canyon National Recreation Area (U.S. National Park Service)
- Weather and Climate - Grand Canyon National Park (U.S. National Park Service)
- Monsoon Season (U.S. National Park Service)
- Weather Dangers - Grand Canyon National Park (U.S. National Park Service)
- Page
- Guided Tours - Glen Canyon National Recreation Area (U.S. National Park Service)
- Horseshoe Bend - Glen Canyon National Recreation Area (U.S. National Park Service)
- Horseshoe Bend (Arizona)